Ward Wise Penlight
Support Penlight
Penlight is a civic-data project built at Chi Hack Night that turns open data into neighborhood wellbeing metrics anyone can explore, weight, and compare. It grows through residents — here's how to help.
Our goal
A metric nominated from every ward
The best measures come from residents: parking difficulty, water-fountain lead, the lakefront, 311 responsiveness — all started as nominations. We're working toward a resident nomination from all 50 Chicago wards; your ward gets the credit on the map.
Loading nominations…
Visual signifiers
Put your area on the map
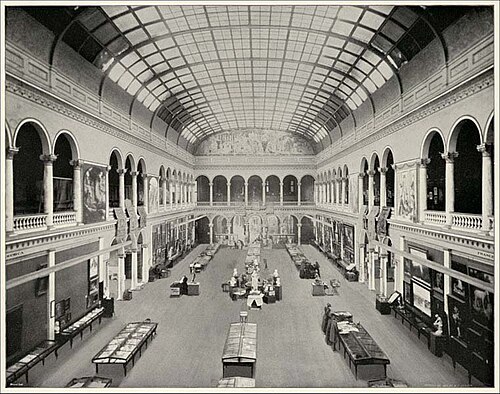
Every ward, neighborhood, and χGRID shows a photo of a real place inside it — with its source, license, and attribution. Know the spot that captures yours? Submit it — reviewed submissions appear with credit to you.



Your block
Host a participatory audit
Gather your neighbors and ask: what does wellbeing actually mean on our blocks? Which measures matter here, and how much? Those answers become your neighborhood's own wellbeing index — a shared equation you can hold up to your government, year after year, to judge its performance against what your community actually values.
Beyond Chicago
Bring Penlight to your city
Open data and open source travel well. We're actively exploring Columbus, Madison, Cincinnati, New York, and Los Angeles — if you want neighborhood wellbeing metrics where you live, raise your hand.
In person
Come to Chi Hack Night
Tuesday evenings — Chicago's weekly gathering for people who use data and technology in the public interest. Penlight is built there; come say hi. No technical background needed.
Developers
Build on the data
Every number here is available through a small read-only API — one ward's metrics in context, and the dictionary that explains them. Keys are free; tell us what you're making.
Since 2026-05-15
Metrics we track over time
We launched with 20 metrics for the Bean's 20th birthday and have grown the catalog — and our representation across the city — since.
Loading history…